Open-source intelligence
Real-Time Iran Conflict Intelligence Dashboard
Conflicts.app is an open-source intelligence dashboard built to track the Iran conflict in real time. 30+ sources spanning Western, Iranian, Israeli, Arab, Russian, and Chinese outlets processed through an AI pipeline into interactive maps, daily briefs, and escalation scoring.
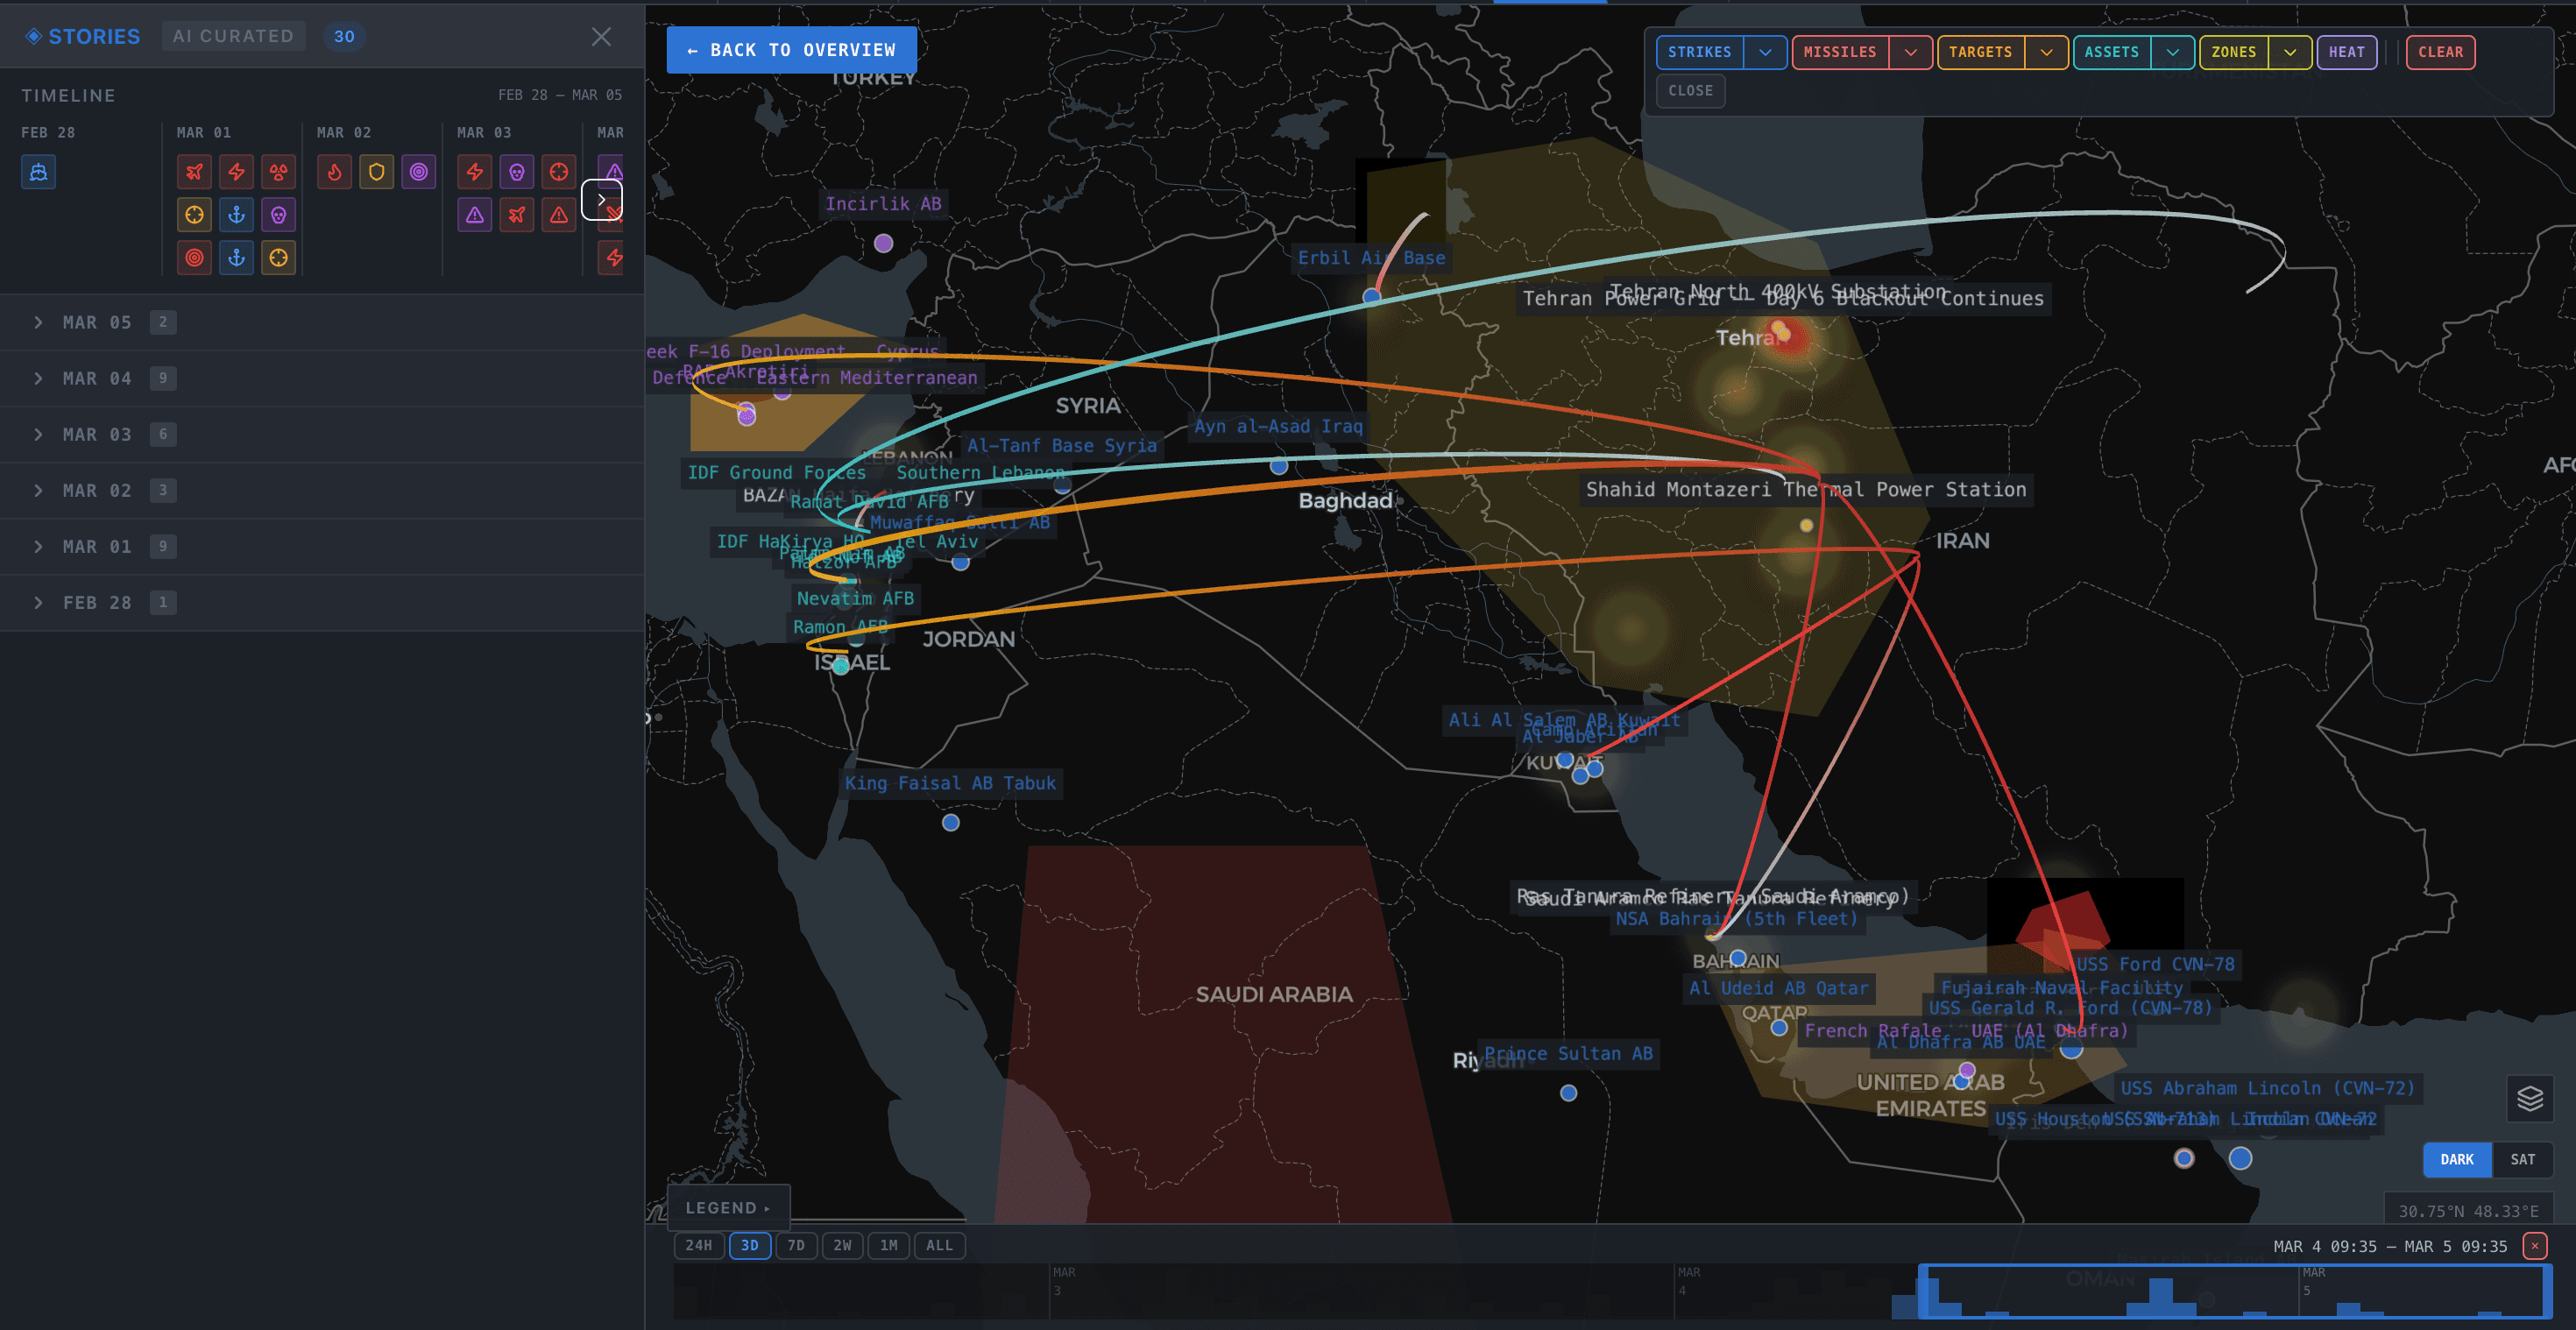
The Pharos dashboard on conflicts.app showing live conflict map, event timeline, and actor intelligence panels.
96 / 100
Escalation score
10+
Factions tracked
30+
News sources
120+
Events logged
What you can track
Interactive conflict map
Every airstrike, missile launch, and troop movement plotted on a map. Filter by day, severity, or actor. Built with DeckGL and MapLibre.
Event timeline
Airstrikes, diplomatic moves, field reports. Each event scored by severity with actors involved and source links. Browse by day or search across the full conflict.
AI intelligence briefs
An AI pipeline continuously processes incoming events and generates situation reports. Key developments, escalation risks, and scenario analysis updated throughout the day.
Actor intelligence
Profiles for every major faction. Iran, Israel, Hezbollah, Houthis, US CENTCOM, NATO, and more. Capabilities, alliances, recent actions, and current stance.
OSINT signals
Curated posts from analysts, journalists, and official accounts on X. Scored by significance and grouped by day so you see what matters, not everything.
RSS monitor
30 feeds from Reuters to Press TV. Western, Iranian, Israeli, Arab, Russian, and Chinese outlets. One place instead of 30 tabs.
Escalation scoring
AI calculates a daily escalation score from 0 to 100 based on event severity, frequency, and actor behavior. Currently at 96.
Economic indicators
Oil prices, currency rates, and market data tied to the conflict. Tracks sanctions impact and regional disruption.
How it works
Open conflicts.app/dashboard.
No account needed.
Pick a conflict day.
Every day is tracked independently with its own events, briefs, and scores.
Read the brief or explore the map.
Start with the situation summary or go straight to the interactive map and dig into individual events.
Built for people who need the full picture
Conflicts.app is used by OSINT analysts, journalists, researchers, policy students, and people in the region who want to understand what's actually happening. Not another news aggregator. An intelligence dashboard that turns raw information into something readable.
Fully open source
Pharos is the open-source project behind conflicts.app. The entire codebase is public on GitHub. Dashboard, API routes, data pipelines, AI brief generation. Licensed under AGPL-3.0.
View on GitHubTech stack
Frequently asked questions
What is Conflicts.app?
Conflicts.app is a free, open-source intelligence dashboard for tracking the Iran conflict in real time. Built under the project name Pharos, it combines an interactive strike map, AI-generated situation briefs, escalation scoring, actor tracking, and an OSINT signal feed into one interface.
Is it free?
Yes. No paywall, no signup, no ads. The project is open source under AGPL-3.0.
Where does the data come from?
Conflicts.app monitors 30+ RSS feeds spanning Western, Iranian, Israeli, Arab, Russian, and Chinese media outlets. An AI agent pipeline processes incoming articles, extracts structured events, scores severity, identifies actors, and generates intelligence briefs. It's not just raw feeds, it's processed intelligence.
What is the escalation score?
The escalation score is a 0–100 metric calculated by AI based on event severity, attack frequency, actor behavior changes, and diplomatic signals. A score above 90 indicates active military conflict with high risk of further escalation.
How often is it updated?
Events are logged as they happen. Intelligence briefs and escalation scores are updated continuously throughout the day as new information comes in.
Who built this?
Conflicts.app was built by Julius Olsson as an open-source project. The goal was to make conflict intelligence accessible to everyone, not just people with access to expensive OSINT platforms.
What tech stack is it built with?
Next.js 16 with the App Router, TypeScript, DeckGL v9 and MapLibre for maps, Prisma 7 with Supabase (PostgreSQL), Redux Toolkit for state management, and deployed on Vercel.
No login required. No paywall.
Open the dashboard →